Watch the following video. Pay close attention to the definition for population density, density dependent, density independent, exponential growth, logistic growth, and carrying capacity.
We have been learning about everything from organism and smaller. We are now moving on to organism and larger. If you remember the levels of organization for the previous lessons started with the atom, molecule, organelle, cell, tissue, organ, organ system, and ending with organism. Continuing to move up from there we have population (the same type of organisms living together), community (many different populations living together), ecosystem (along with different populations this adds the abiotic factors, weather, water, soil), biosphere (all living beings and their relationships, including their interaction with the elements of the lithosphere, geosphere, hydrosphere, and atmosphere).
Looking closer at populations. Population density is the number of individuals in a given area. Population size can change by having individuals born, individuals die, individuals move in, or move out. A population increases when the birthrate rises or immigration (moving in) rises. A population will decrease with the death rate increases or emigration (moving out) increases.
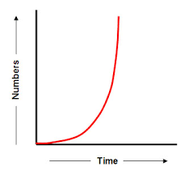
There are 2 types of growth curves, the S-curve and the J-curve. Aptly named for the letter they look like. The J-curve represents exponential growth. This is when a population doubles each generation. This is able to happen when there are unlimited resources (water, food, shelter, mates). Below is shows the J-curve.
Looking closer at populations. Population density is the number of individuals in a given area. Population size can change by having individuals born, individuals die, individuals move in, or move out. A population increases when the birthrate rises or immigration (moving in) rises. A population will decrease with the death rate increases or emigration (moving out) increases.
There are 2 types of growth curves, the S-curve and the J-curve. Aptly named for the letter they look like. The J-curve represents exponential growth. This is when a population doubles each generation. This is able to happen when there are unlimited resources (water, food, shelter, mates). Below is shows the J-curve.
|
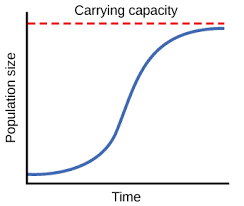
The S-curve shows logistic growth, which is the shape of an s. This growth starts out the same as exponential, but it hits a point where the growth slows then stops. This point is called the carrying capacity. This is how many individuals an ecosystem can support. This is do to limited resources (food, shelter, mates).
|
|
Many things can limit a population. There are 2 types that we will discuss, density dependent limiting factor and density independent limiting factor. Density dependent limiting factors are factors whose effects on the size or growth of the population vary with the population density. For example the more individuals that are in an area, the easier it is for a diseases or illnesses to spread. Along with disease, other examples include: food supply, competition, predation.
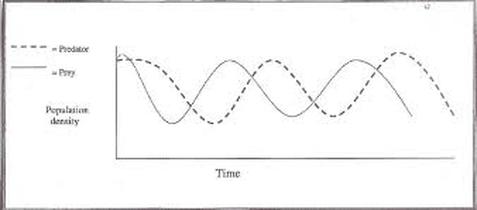
- Predation is effected by the size of the population, becuase if the rabbit (prey) population is increasing, that means there will be more food for the wolves (predator). As the predator population increases, then the rabbit population will decrease, because there are more predators to carry. The predator does not want to eliminate the prey population, because they would also be eliminated due to lack of food. Look at the following graph. Notice how the predator moves the same way as the prey, but it happens a little later. Once the rabbits (prey) start to decrease, a couple generations later the wolves (predators) also start to decrease.
- Predation is effected by the size of the population, becuase if the rabbit (prey) population is increasing, that means there will be more food for the wolves (predator). As the predator population increases, then the rabbit population will decrease, because there are more predators to carry. The predator does not want to eliminate the prey population, because they would also be eliminated due to lack of food. Look at the following graph. Notice how the predator moves the same way as the prey, but it happens a little later. Once the rabbits (prey) start to decrease, a couple generations later the wolves (predators) also start to decrease.
Density indepenedent limiting factors are factors that limit the population size, but do not rely on the number of individuals in the population. An example of such a factor is an earthquake, which will kill all members of the population regardless of whether the population is small or large.
Biodiversity
Biodiversity is the variety of life in the world or in a particular habitat or ecosystem. Biodiversity boosts ecosystem productivity where each species, no matter how small, all have an important role to play.
A healthy biodiversity provides a number of natural services for everyone:
But why is biodiversity decreasing? Remember HIPPO+C
H-Habitat Loss- organisms are losing there homes due to deforestation, and city expansion
I-Invasive Species - a species that is not from that area. It has been brought to the new area due to human involvement. (Native species are the ones that have evolved from the area. Invasive species usually hurt the biodiversity of native species)
P-Population of humans increasing
P - Pollution - the water, land, and air are all being polluted
O - Over-harvesting - taking too much food
+C - Climate Change - as global warming is happening, the earth is heating up, which change the ecosystems.
Biodiversity
Biodiversity is the variety of life in the world or in a particular habitat or ecosystem. Biodiversity boosts ecosystem productivity where each species, no matter how small, all have an important role to play.
A healthy biodiversity provides a number of natural services for everyone:
- Ecosystem services, such as
- Protection of water resources
- Soils formation and protection
- Nutrient storage and recycling
- Pollution breakdown and absorption
- Contribution to climate stability
- Maintenance of ecosystems
- Recovery from unpredictable events
- Biological resources, such as
- Food
- Medicinal resources and pharmaceutical drugs
- Wood products
- Ornamental plants
- Breeding stocks, population reservoirs
- Future resources
- Diversity in genes, species and ecosystems
- Social benefits, such as
- Research, education and monitoring
- Recreation and tourism
- Cultural values
But why is biodiversity decreasing? Remember HIPPO+C
H-Habitat Loss- organisms are losing there homes due to deforestation, and city expansion
I-Invasive Species - a species that is not from that area. It has been brought to the new area due to human involvement. (Native species are the ones that have evolved from the area. Invasive species usually hurt the biodiversity of native species)
P-Population of humans increasing
P - Pollution - the water, land, and air are all being polluted
O - Over-harvesting - taking too much food
+C - Climate Change - as global warming is happening, the earth is heating up, which change the ecosystems.
Practice Problems
1. What are the levels of organization from smallest to largest?
2. Is food supply a density dependent or density independent limiting factor?
3. What is the amount of individuals an ecosystem can support?
4. Which curve shows logistic growth?
5. A populations growth rate is decided by 4 factors, what are they?
6. What will happen if a species grows larger than its carrying capacity?
7. What is biodiversity?
8. Why is biodiveristy declining?
9. Is an avalanche (a rapid flow of snow down a sloped surface) a density dependent or density independent limiting factor?
10. Which type of curves shows a carrying capacity?
